 Contact me at www.kimlouie.net for a Free Home Value Report!
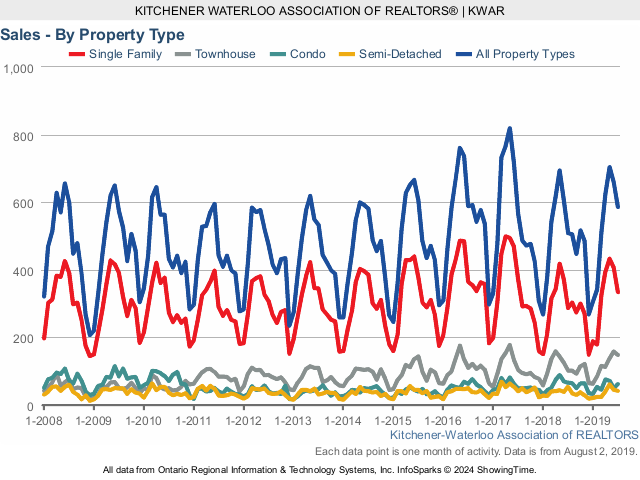
KITCHENER-WATERLOO, ON (August 6, 2019) ––586 residential properties sold through the Multiple Listing System (MLS® System) of the Kitchener-Waterloo Association of REALTORS® (KWAR) in July, representing an increase of 15.1 per cent compared to the same month last year.
Home sales in July included 322 detached (up 16.4 per cent),
and 62 condominium apartments (down 6.1 per cent). Sales also included 148
townhouses (up 45.1 per cent) and 42 semi-detached homes (down 22.2 per
cent).
“Home sales continued their strong momentum from last month,” says
Brian Santos, KWAR President. “On a year-to-date basis we’re seeing sales
have increased slightly over last year.”
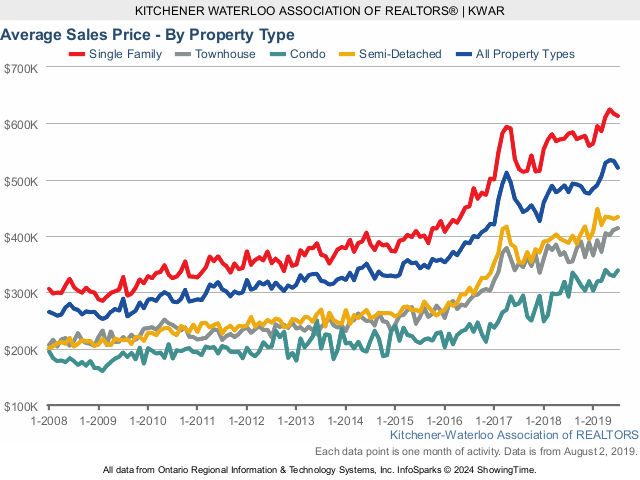
The average sale price of all residential properties sold in
July increased by 9.3 per cent to $521,101 compared to July 2018. Detached homes
sold for an average price of $613,244 (an increase of 5.4 per cent compared
to July of last year. During this same period, the average sale price for an
apartment-style condominium was $339,137 for an increase of 15.9 per cent.
Townhomes and semis sold for an average of $414,062 (up 17 per cent) and
$434,136 (up 11.9 per cent) respectively.
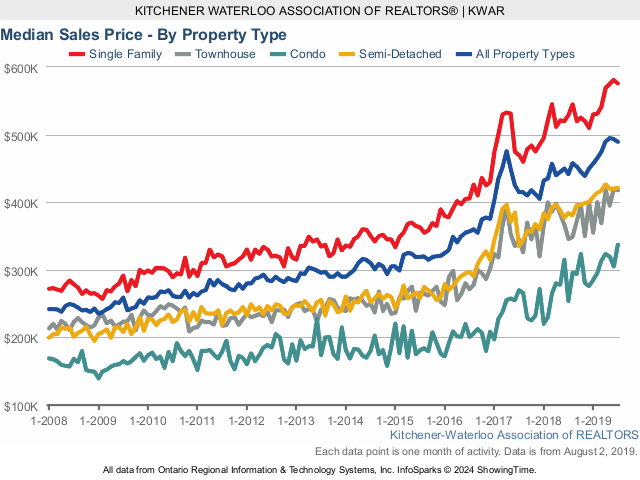
The median price of all residential properties sold last month
increased 10.8 per cent to $489,450 and the median price of a detached home
during the same period increased by 8.8 per cent to $575,750
REALTORS® listed 844 residential properties in K-W and
area last month, an increase of 12.8 per cent compared to July of 2018, and
an increase of 10.4 per cent in comparison to the previous ten-year average
for the month of July The total number of homes available for sale in active
status at the end of July totalled 863, a decrease of 8.7 per cent compared
to July of last year, and well below the previous ten-year average of 1,467
listings for July. Months Supply of Homes for sale stood at 1.7 months in
July, which is 15 percent lower than the same period last year.
“The temperature is matching the market,” says Santos. “we’re
continuing to see strong consumer demand that is making for a busier than
normal market for the middle of summer.”
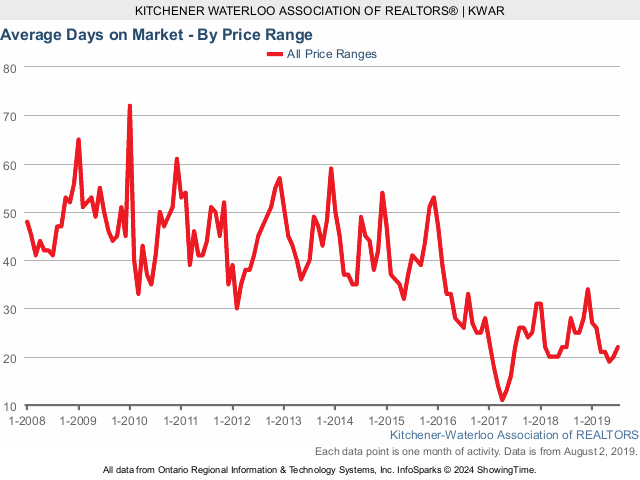
The average days it took to sell a home in June was 22 days,
which is the same number of days it took in July 2018.
Historical Sales By
Property Type
Months Supply of Homes for
Sale
Historical Median Sales
Price – By Property Type
Historical Average Sales
Price – By Property Type
Historical Sales - By Price
Range
Average Days on Market


No comments:
Post a Comment